Portfolio Management - Polaris Private Equity
Implementation of the Polaris Sustainability Program
At the end of 2025, the Polaris Sustainability Program was implemented across the majority of our private equity portfolio. During the period, overall implementation levels remained broadly unchanged, reflecting that no companies were acquired or divested during the period.
Implementation and maturity continue to vary across companies. While some have made incremental progress—including Distriktstandvården, which will publish its first sustainability report in 2026—others, particularly more recent acquisitions such as Salfarm, are still in earlier stages of establishing foundational sustainability processes.
The work with sustainability throughout Polaris’ private equity portfolio is aligned with the Polaris Sustainability Program, either through direct implementation of the program or through comparable and fundamentally aligned processes. This ensures that portfolio companies address the same core sustainability components, even where implementation varies depending on company context.
The Polaris Sustainability Program is designed to support companies in developing their sustainability platforms over time. We aim to implement the program as soon as practically possible and typically within 12 months following an acquisition. Implementation is expected across all portfolio companies. However, we prioritize efforts based on each company’s starting point, risk profile, and operational priorities.
Implementation of the Polaris Sustainability Program

Climate Action in Polaris’ portfolio
Our approach to climate action is based on measuring and tracking the GHG emissions of our portfolio companies annually. This creates transparency and provides a foundation for identifying and implementing relevant emission reduction initiatives.
We encourage and support our portfolio companies to set reduction targets in line with the Paris Agreement through Science-Based Targets (SBTs) approved by the Science-Based Targets initiative (SBTi). In 2025, Polaris’ own Science-Based Target as a fund manager was approved by the SBTi.
Our target for private equity investments is to achieve 100% portfolio coverage of companies with approved SBTs by the end of 2030.[1]
[1] This Polaris Portfolio Coverage Target is calculated as the % of the Invested Capital of companies with their own SBT approved by the SBTI of the total Invested Capital, which includes all portfolio companies owned for more than 24 months.

Climate action
Most portfolio companies owned for more than two years measure their greenhouse gas (GHG) emissions across Scopes 1, 2, and 3 in line with the GHG Protocol. In a limited number of cases, emissions are still based on top-down estimates, this year using Novata benchmarks. This applies to Cepheo across Scopes 1, 2, and 3, and to Scope 3 for Awardit, which reported its own Scope 1 and 2 emissions in 2025.
As in previous years, emissions data across the portfolio continue to develop as companies refine methodologies, improve underlying data, and expand scope coverage. This includes a gradual shift from spend-based estimates toward activity-based and supplier-specific data, as well as the inclusion of additional Scope 3 categories. Changes in portfolio composition, including acquisitions and business developments, also affect reported emissions.
Fund IV
Total emissions in Fund IV decreased during the period, and emission intensity declined from 30.4 to 27.6 tCO2e/mDKK revenue. Emissions remain highly concentrated in the transportation and logistics segment, with Vikingbus and Link Logistics together accounting for 93% of total Fund IV emissions in 2025.
The decrease was driven primarily by Vikingbus, reflecting both lower fuel consumption and methodological refinements, particularly within Scope 3. This was partly offset by an increase in Link Logistics of approximately 23% year-on-year, driven by higher activity levels, expanded Scope 3 coverage, and higher energy consumption.
Overall, developments in the fund continue to reflect a combination of operational change and improving data quality.
Fund V
Total emissions in Fund V decreased during the period, and emission intensity declined from 58.2 to 38.4 tCO2e/mDKK revenue. Emissions remain highly concentrated, with Micropower accounting for the majority of total emissions and G&O Maritime Group a significant additional share.
The year-on-year decrease was driven mainly by Micropower, where emissions fell approximately 19%. This reduction primarily reflects a change in the emission factors applied to the use phase of products in Europe, rather than an equivalent change in underlying business activity.
Developments across the remainder of the portfolio were more mixed. G&O Maritime Group declined slightly overall, reflecting a combination of operational changes and updates to emissions methodology and scope. Reported Fund V emissions include Salfarm for the first time in 2025.
Overall, year-on-year developments reflect a combination of company-specific operational changes, portfolio composition, and continued improvements in emissions measurement and methodology.
There continues to be significant variation in emissions and emission intensity across the portfolio, reflecting differences in business models, sector exposure, and measurement approaches. We expect this to persist.
Polaris does not exclude companies with higher emissions. Our focus is on whether emissions can be responsibly managed and reduced over time, and whether we can support portfolio companies in delivering meaningful decarbonization.
Table overview of all absolute emissions (tCO2e)

Gender Equality in Polaris’ portfolio
With Gender Equality as a focus area, the share of women in the board of Directors and the management team has been chosen as a cross-portfolio KPI for Polaris, and we also provide information on the gender balance of each organization. Thus, all portfolio companies report annually on the gender balance across their organization, and Polaris reports on this KPI for each fund and the portfolio as a whole. The work is focused on ensuring a balanced workforce by increasing the share of the underrepresented gender.
Gender equality
Our portfolio companies report on gender distribution across boards, management teams, and employees, and they are increasingly formalizing strategies, targets, and initiatives to improve gender balance. This supports our ambition to progress toward more balanced representation, particularly at board and management levels, and provides a consistent basis for discussion and follow-up at portfolio company level.
At board level, representation remained broadly unchanged at the portfolio level. Developments at fund level were limited, with small movements driven primarily by changes in board composition and portfolio perimeter.
At management level, the share of women increased to 31% (2024: 27%), reflecting gradual progress across the portfolio.
We continue to see this as a long-term focus area and remain committed to supporting progress across the portfolio, including through recruitment processes, target-setting, and ongoing engagement with portfolio company leadership teams.

Employer Responsibility in Polaris’ portfolio
Being a responsible employer—ensuring safe, secure, and healthy working environments and respecting labor rights—is a core expectation across Polaris’ portfolio companies. This focus supports both employee well-being and long-term value creation through stronger attraction, retention, and engagement of talent.
Employee turnover
Employee-initiated turnover remains a key indicator across the portfolio. At the portfolio level, turnover remained broadly stable year-on-year. As in prior years, variation between companies remains significant, reflecting differences in business models, workforce composition, and periods of organizational change. This is particularly relevant for companies with a higher share of temporary employees or restructuring activity. Overall, Polaris considers observed turnover levels to be within an expected range and continues to monitor developments closely.

Portfolio company sustainability reporting













- Fund IV: Five of six companies publish sustainability reports. Distriktstandvården will publish a sustainability report for the first time this year, while Vikingbus does not yet publish a report.
- Fund V: Eight of eleven companies publish sustainability reports. Cepheo, Awardit, and Salfarm do not yet publish reports.
Our Scope
We apply our sustainability strategy to all private equity investments in Fund IV and V. These two funds constituted 69% of our total invested capital in Polaris and included seventeen portfolio companies at the end of 2025.
We align our work with established standards and frameworks
Our sustainability program is grounded in international standards and frameworks to ensure alignment with best practice in the field. We seek to adopt the most concrete and specific sustainability processes that focus on materiality. The standards and frameworks upon which we base our work are described throughout this section.
Methodology for greenhouse gas emissions accounting
We began calculating greenhouse gas inventories for Polaris Management A/S and our private equity portfolio companies in 2020. Our standard process is supported by external advisors and adheres to the Greenhouse Gas (GHG) Protocol. Inventories are established through bottom-up exercises, which we believe is necessary to build understanding and ownership in the organizations and thereby support decarbonization efforts.
At any given time, some portfolio companies may not yet have been onboarded onto our GHG emissions calculation process. To provide an estimate of the complete emissions for our private equity funds, we estimate the emissions of such companies with the help of external benchmarks. We continuously work to onboard new companies to emissions tracking with an ambition to have an inventory established within twelve months of closing.
Boundary setting and consolidation approach: Polaris uses the “Operational Control” approach to organizational boundary setting. We do this because our investment strategy typically gives us majority control through majority ownership. As such, we have the mandate to introduce and implement operating policies in our portfolio companies, and we therefore also take full responsibility for the emissions thereof in our GHG inventory. Although we do not technically have majority ownership in all portfolio companies, we do adopt this consolidation approach for all portfolio companies, acknowledging that we still exert a strong influence even where we are not majority owners.
We consolidate GHG emissions first at the relevant private equity fund level and then at the Polaris Private Equity level, where we also include Polaris Management’s own emissions, although a portion of these should also be allocated to Polaris’ other investment strategies.
Quality and comparability: While emissions are consolidated across portfolio companies to estimate full Polaris private equity emissions (including Polaris Management and all private equity portfolio companies), we acknowledge that the inventories are not directly comparable on an individual basis.
For the companies that have been through our process, these may still vary greatly with respect to complexity, both regarding the type of operations, but also with regards to procurement and reporting being more decentralized in some companies compared to others. This means that the data available for some companies may not be as readily available for others, why the same activity may have been estimated with a different calculation method across portfolio companies, or may not have been included in the base year for some companies due to lack of available data. While these portfolio companies have defined their own operational boundaries, to ensure it reflects their operations and business model, all companies use the operational control approach. To define the operational boundaries, they have gone through all the Scopes and categories of the GHG Protocol and assessed their relevance and feasibility based on the principles of relevance, completeness, accuracy, consistency, and transparency.
We have mainly used one specialized advisor to support our portfolio companies in setting up their GHG emission calculations, which supported seven of our private equity portfolio companies with calculations for 2025. Other specialists support five of the remaining companies and have also generally followed the same methodology with some variations. One company did not perform any of its own calculations (Cepheo), whereas one company provided calculations only for Scopes 1 and 2 (Awardit). In these cases, we used top-down estimates based on external benchmarks to cover the missing data.
In our process, GHG emissions have been calculated through a combination of approaches, including the activity-based method (based on activity data such as total weight of a product, total passenger-kilometers flown, or other relevant metrics), the spend-based method (based on spend on a specific activity or category), and the supplier- and product-specific method (based on actual emissions per SKU or supplier-provided data).
Each inventory process has been initiated with establishing a spend-based estimate, which has been used to prioritize further data collection efforts with the aim of increasing accuracy through moving towards more detailed calculation methods.
Data has been extracted from the respective ERP-systems and invoices and collected from key suppliers when relevant and available (especially purchased energy services, logistics services, waste management services etc.). Where data for applying these methods have not been available, emissions for selected categories have been estimated based on proxy data. For example, for selected portfolio companies, where actual energy consumption was not available for specific sites, energy consumption has been estimated based on the size of facilities and average annual national energy consumption per square meter for a specific facility type (such as office spaces).
Similarly, emissions from employee commuting have in some cases been based on central assumptions and publicly available data on local commuting patterns.
GHG intensity is calculated based on revenue when consolidating the emissions across portfolio companies or otherwise in accordance with industry standards on portfolio company level to allow for comparisons against competition to the greatest extent possible – knowing that a complete “apples to apples” comparison is not possible due to differences in especially Scope 3 coverage, data quality, and methodology between different companies.
GHG intensity and totals are calculated as total Scope 1, Scope 2 (location-based), and Scope 3 emissions. Polaris uses the location-based approach as the main approach when consolidating emission totals and reporting on measures to ensure comparability across portfolio companies regardless of renewable energy procurement. In alignment with the GHG Protocol’s dual Scope 2 reporting requirement, we also publish the market-based Scope 2 results.
Each portfolio company that completes our standard GHG inventory process also develops an emissions data improvement and reduction roadmap. We acknowledge that the quality of each company’s baseline will improve over time, and that there will be uncertainties and gaps in the inventory due to lack of sufficient data. As we strive for continuous improvement over time, these roadmaps include plans to improve the breadth and depth of data collection in the following years. This includes integrating excluded activities that have been deemed significant in terms of the magnitude of emissions, but where sufficient data is not yet available. Further, the roadmaps include a plan for decarbonization initiatives.
At Polaris we request that the roadmap, together with the baseline itself, be approved by the portfolio company’s Board of Directors to ensure commitment to and accountability of the efforts planned. Our SBTi-approved portfolio coverage target aims to have 100% of private equity portfolio companies with their own approved SBTs by 2030.
Emission factors have been collected via environmental product declarations (EPDs), research-based Life-Cycle-Analyses (LCAs), from the UK Department for Environment, Food & Rural Affairs (DEFRA), the International Energy Agency (IEA), ecoinvent, supplier data, and otherwise known and qualified emission factor databases. To the extent possible we have gathered multiple datapoints for each emission factor to validate the sources used.
When working with spend-based emissions factors, these have been adjusted for inflation and currency, to best reflect the working data that they are being applied to.
For Scope 2 electricity calculations, for Danish electricity consumption we have used Energinet’s (the Danish Transmission System Operator) emission factor based on consumed electricity from the grid, while we for all other countries have used IEA’s database and emission factors for produced electricity within the respective countries. We use Energinet as a source for Denmark because most portfolio companies have facilities located in Denmark, and as such we see it as a means to improve the accuracy of the GHG inventory across the portfolio, as Energinet provides grid-specific factors.
We recognize that we will continuously improve our understanding of our emissions and refine our scope and calculation methods over time to improve the accuracy of our calculations and in turn our GHG inventory. Furthermore, given the nature of our operations, the composition of our portfolio will change over time as new companies are acquired and current companies are exited. As such, we have defined a recalculation policy in line with the GHG Protocol.
The Recalculation Policy states that, in the case of structural changes—for example, acquisitions, divestments, mergers, outsourcing or insourcing—we will clearly indicate in the report any added or subtracted parts of the baseline, which can then not be used for year-on-year comparisons. The same applies to the inclusion of additional Scope 3 categories. In the case of methodological change, for example, a change in emission factors, data accuracy, discovery of a significant error (or similarly, a number of cumulative errors that collectively have a significant impact on the GHG baseline), it will trigger a recalculation of the previous 2-3 years to ensure GHG baselines are comparable over time.
Sustainability KPI identification
Identifying material impacts
As a starting point for sustainability strategy, action planning and KPI selection, all portfolio companies should go through a process to identify their material impacts, positive and negative, related to sustainability from both an impact and financial perspective across their value chain (so called ‘double materiality’). Recently, this has often been done through a Double Materiality Assessment (DMA) process conducted in-line with the Corporate Sustainability Reporting Directive (CSRD) guidelines. We seek to establish the material impacts already in the due diligence process. This can be informed by external benchmarking and SASB Materiality Maps.
Core sustainability KPIs
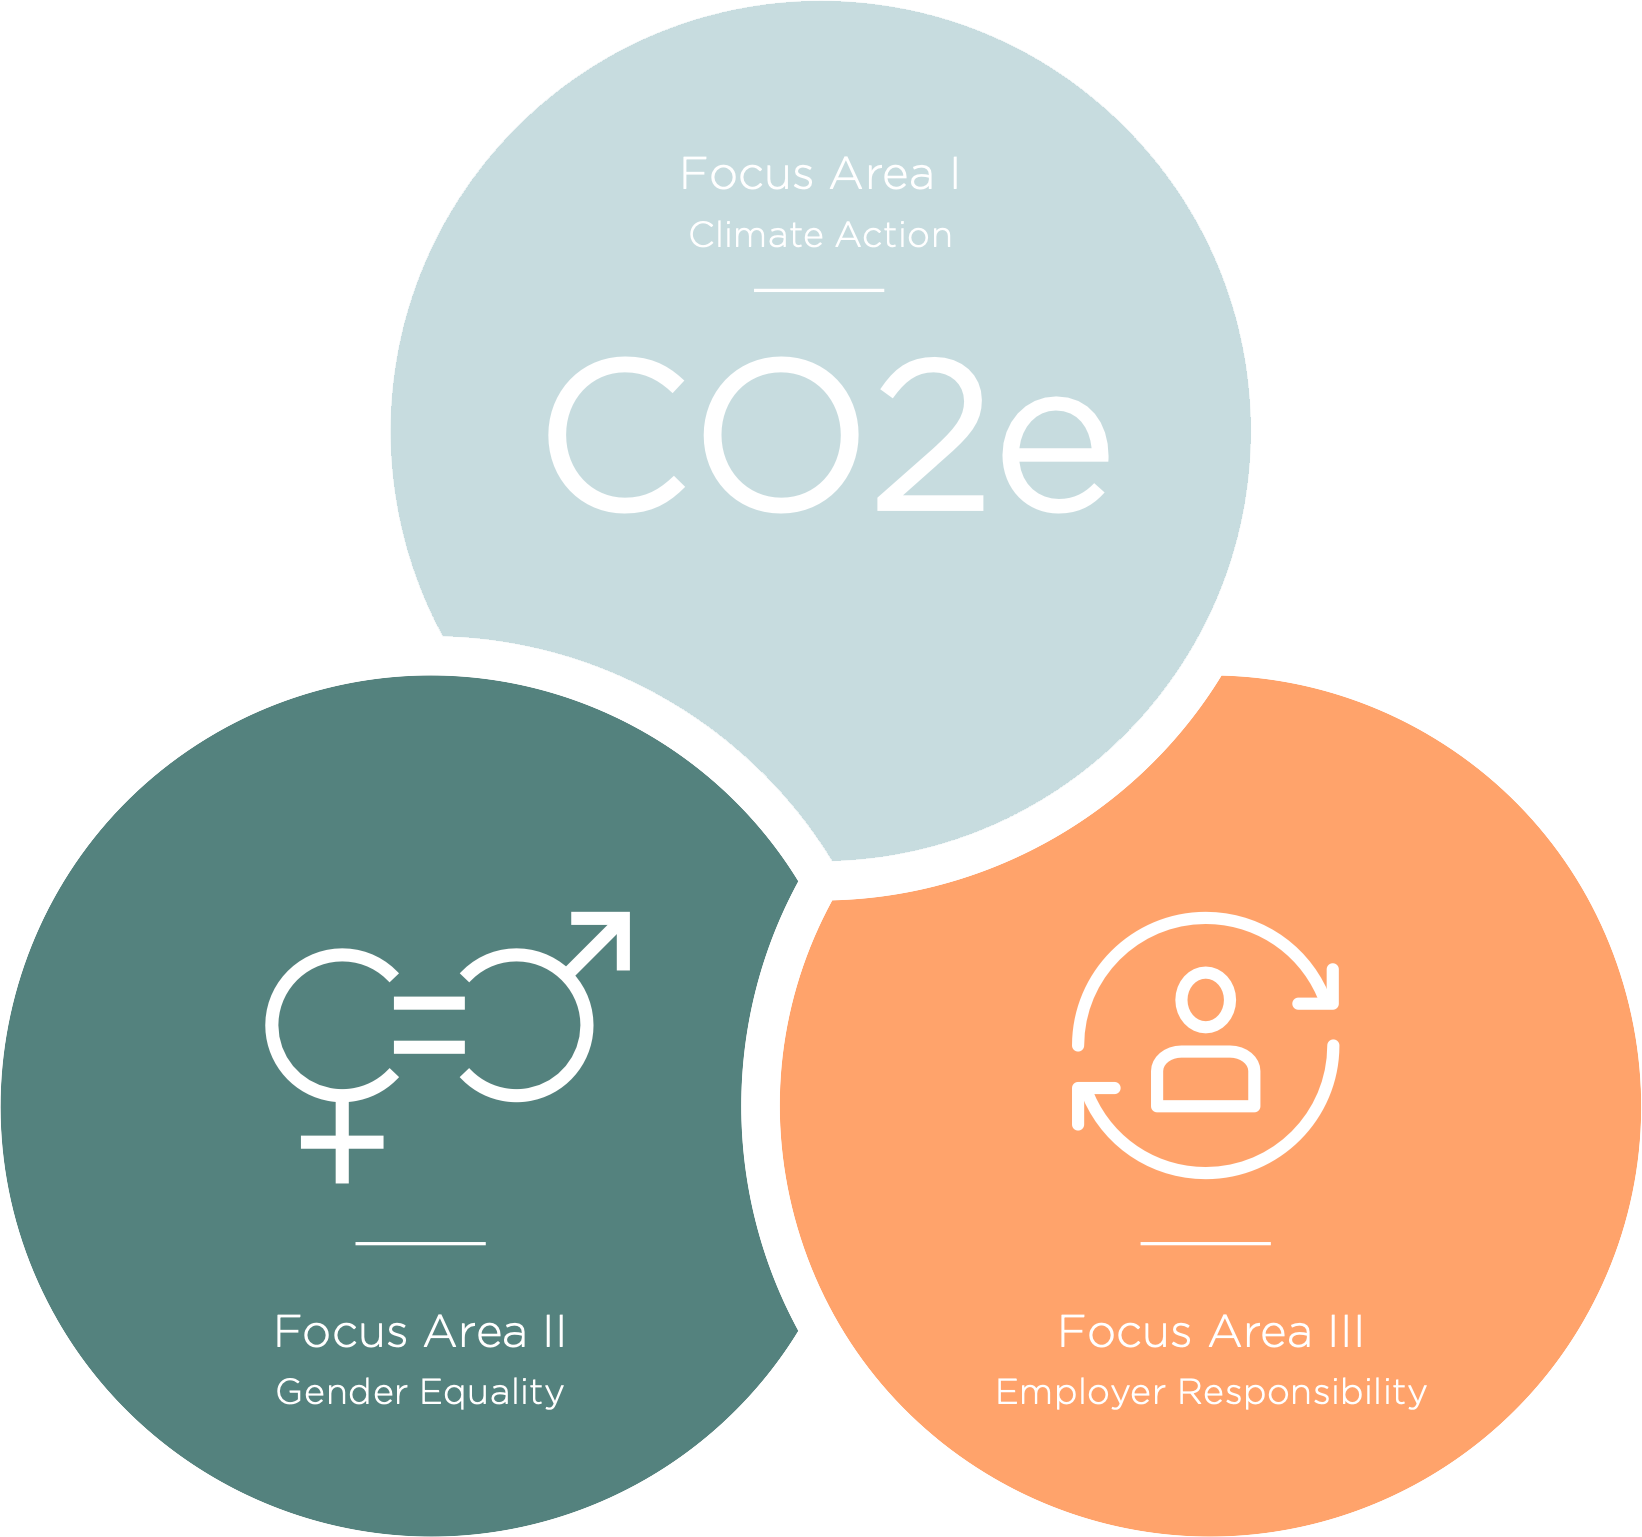
Three core sustainability KPIs have been selected by Polaris as we believe these are generally material for the majority of companies. These will be reported on across portfolio companies following SASB standard reporting practices (please see below section for more information on SASB). The Core sustainability KPIs are related to our three Focus Areas:
Company specific sustainability KPIs
Each portfolio company should select at least three company specific sustainability KPIs that are relevant for their business and their identified material impacts. The primary concern is to identify an indicator which is the most relevant for the specific company but if possible, we aim to use indicators defined by international standards such as the EU regulations SFDR and CSRD, the SASB standard reporting practices or the Global Reporting Initiative (GRI).
The EU regulations SFDR and CSRD
contain a large number of sustainability indicators in the Principal Adverse Impact tables and ESRS E1-5, S1-4 and G1.
These indicators are used broadly throughout Europe by financial institutions and companies in their sustainability reporting. It is therefore advantageous for companies to align with these indicators whenever possible to facilitate understanding and benchmarking and also to prepare for future reporting requirements.
The Sustainability Accounting Standards Boards (SASB) materiality map
is based on studies of 77 industries and more than 4000 cases to identify relevant disclosure topics across different industries and sectors.
The SASB materiality maps are used as they are a broadly accepted and well-founded standard to guide the disclosure of financially material sustainability information by companies to their investors. The approach is focused on identifying quantitative and qualitative measures that are likely to impact a company’s financial performance and at the same time provides an industry-specific lens in recognition of the fact that the issues most likely to impact financial performance vary by industry. The SASB standard can therefore provide us with market-informed material sustainability measures but also help us increase sustainability transparency towards our investors and future owners of our portfolio companies.
The Global Reporting Initiative (GRI)
is an independent, international organization that provides a globally recognized framework for sustainability reporting. It helps businesses and other organizations understand and communicate their impacts on the economy, environment, and society.
GRI's standards are widely used for organizations to disclose their environmental, social, and governance (ESG) impacts and we can use them to ensure alignment and comparability of our portfolio companies sustainability reporting.

How we assess climate risks and opportunities
We assess our portfolio companies’ climate-related risks and opportunities in line with the Task Force on Climate- related Financial Disclosures’ (TCFD) risk and opportunity framework. We have conducted a high-level assessment of each of the portfolio companies included in this report and prioritized the companies according to their estimated exposure to climate change risks and opportunities. The result of this high-level assessment can be seen in the TCFD prioritization matrix below where the companies initially prioritized for the TCFD analysis are to be found on the right hand side of the matrix. Having identified those companies we believe to be most exposed, it is our ambition for each of them to conduct a TCFD analysis.
As part of the TCFD analyses the companies have conducted analyses of e.g. expected GHG tax scenarios based on their calculated GHG baselines and the carbon tax recommendations put forward by the Danish Climate Council and IMF in relation to a 1.5 and a 2 degree scenario. Following the analyses, initiatives to address the key risks and opportunities identified have been formulated. These initiatives have been prioritized and aligned with the overall strategy of the company and other organizational priorities and presented as part of the consolidated sustainability roadmap for Board approval. Each portfolio company should revisit their TCFD analysis regularly to ensure continuous focus on climate-related risks and opportunities and identify any relevant changes in relation to these.
At Polaris, we have formally integrated the TCFD framework as a structured approach to assessing climate-related risks and opportunities in our due diligence process. Hence, for all investments made in Fund V, a separate assessment of the individual investment case's exposure to climate changes has been carried out in addition to the other sustainability analyses conducted in our due diligence process. This analysis is an important element of the overall sustainability assessment of the investment case and the decision foundation for the investment committee in Polaris Management.
TCFD prioritization matrix


Our Sustainability Principles - the Principles of Responsible Business Conduct in our private equity strategy
Polaris sustainability principles define responsible business conduct based on the UN Guiding Principles on Business and Human Rights and OECD Guidelines for Multinational Enterprises. These Principles are the foundation for making the ten principles of the UN Global Compact operational and constitute a global minimum standard for responsible business conduct.
The ambition for all the portfolio companies in Polaris Private Equity is to align their work with this global minimum standard for responsible business conduct. This work is initiated in a 5-day onboarding process which we aim to initiate within 12 months post the closing of each acquisition as part of 'Polaris Sustainability Program'. The process generates the following content and output, which forms the basis for the formulation of the companies' sustainability strategy:
Impact Assessments/Capacity Development process (5-day onboarding)
- Introduction: Introduction to the global minimum standard for responsible business conduct
- Definition of sustainability: Introduction to the key fundamental elements of sustainability through 84 potential impact areas:
- Environmental impact - 20 areas
- Social impacts - 48 areas (human and labor rights)
- Economic impacts - 16 areas
- Policy commitment: Formulation of a sustainability policy and a formal commitment to the minimum standard for responsible business conduct
- Impact Due Diligence: Implementation of due diligence processes and completion of the first assessment including:
- Identification of potential negative impacts
- Assessment of risk levels, existing actions and additional actions to prevent or mitigate the risks identified, and indicators to measure effectiveness of actions
- Action plans: Listing of coming actions to prevent or
- mitigate impacts, estimate of resources and person responsible
- Business relationships: Construction of a Code of Conduct for Business Relationships
- Grievance mechanisms: Outlining the basis for establishment of grievance mechanisms in the company
- Cloud-based tool: The documentation of the outcome and follow-up of the Impact assessments (due diligence) are managed in a dedicated cloud-based tool: SEE Impacts (by Global CSR).
The resulting sustainability policy, business relationship Code of Conduct, impact assessments as part of a management system (due diligence process and governance, action plans and grievance mechanisms) are approved by the company Board of Directors after which the company applies for membership in UN Global Compact.
Following the process, the portfolio company is also able to comply with the EU regulations that directly reference our Sustainability Principles: the SFDR, CSRD, the EU Taxonomy (Minimum Safeguards) and the upcoming CSDDD.
Workplace health as a commercial lever
Contour Design provides ergonomic input devices designed to reduce strain from computer work. Through a quantified business case linking musculoskeletal pain to cost, Contour has demonstrated in a recent customer engagement how workplace ergonomics can shift procurement from reactive, individually triggered purchases toward proactive, standard inclusion. Taking a structured and data-driven approach to its social sustainability work, Contour is working to change the underlying demand model, with the aim of expanding adoption beyond medically identified need and embedding ergonomics into default workplace setups. The case highlights observed customer behavior in a recent engagement, rather than assumed future adoption.
The problem
Unaddressed workplace pain is a measurable cost
Musculoskeletal disorders represent both a workforce health risk and a material social sustainability issue, with direct implications for productivity and cost:
69%
of affected employees take additional breaks
~4.1h
productivity lost per employee per week
This reframes workplace ergonomics from a discretionary benefit to a cost and workforce performance issue, creating a clear basis for commercial decision-making.
The mechanism
From social sustainability to quantified business case
Contour supports customer decision-making by translating workplace health into a simple, defensible investment case.
~€370
per employee
device cost
~€3,200
annual benefit
(reduced absence & regained productivity)
~2 months
payback period
Supporting product evidence:
9 out of 10
users report pain relief
87%
would recommend the product
Contour’s investment in sustainability data and evidence creation supports commercial value creation by enabling a more compelling customer business case.
This approach is facilitated by cross-functional collaboration between Sustainability (evidence and positioning), Sales (commercial dialogue), and Support (customer implementation) and supported by the company’s structured evidence development.
Supporting logic: Pain ROI Policy Default
Reactive model
Physician-triggered
Opt-in
Adoption limited
Used after pain emerges
Step change
Default workplace standard
Default model
Standard workplace tool
Opt-out
Broad adoption
Preventive use
Commercial impact
Changing how customers purchase expands demand
This shift to default inclusion-demonstrated in a recent customer engagement—has clear commercial implications. Rather than competing for individual, needs-based purchases, Contour's products can become embedded in standard workplace setups.
Illustrative outcome from a recent customer engagement:
~200
devices procured
~25% of fixed workstations
5–50%
adoption range by team
depending on role and desk structure
While adoption is not universal, the key change is structural:
Early evidence suggests demand can shift from medically constrained to structurally enabled through standard workplace design. Contour expands demand by removing adoption barriers, not just winning individual purchases.
Forward-looking
Embedding sustainability in customer workflows
As customer expectations evolve, there is growing demand for product-level emissions data to support procurement decisions and reporting requirements. Contour is developing a capability to integrate this data directly into customer workflows:
- CO₂ data is included in invoices
- Data flows automatically into customer ERP systems
- No additional processing or manual input required
This approach reduces friction for customers and aligns sustainability data with existing operational processes.
Sustainability creates value when embedded in workflows, not delivered as standalone reporting.
Sustainability data workflow: Zero-friction integration
1
CO₂ product data
2
Invoice
3
Customer ERP system
4
Procurement & reporting
No additional steps required for the customer. CO₂ data flows directly from product invoice into customer ERP — no manual processing required.
Polaris perspective
Translating sustainability into commercial capability
Polaris encourages portfolio companies to link sustainability to tangible business outcomes and customer value. In the case of Contour, this includes:
- Translating social sustainability (workplace health) into commercially actionable capabilities
- Supporting the development of ROI-based sales tools
- Anticipating evolving customer requirements, including emissions transparency
- Enabling capabilities that can be directly integrated into customer decision-making
This approach helps position sustainability not as a reporting obligation, but as a source of commercial advantage.